Production under expectations
The wind index 2017 is a key indicator to compare the wind over the year that has just ended with the wind registered over the previous years.
Assuming that:
- Production forecast selected in the financial model is consistent with the P50 issued from the pre-construction yield analysis;
- The P50 issued from the pre-construction yield analysis is representative of the production over the last ten or twenty years;
- There is a proportional coefficient between the wind and the production;
- The wind index 2017 should be proportional to the ratio between the production of your asset in 2017 and the production forecast.
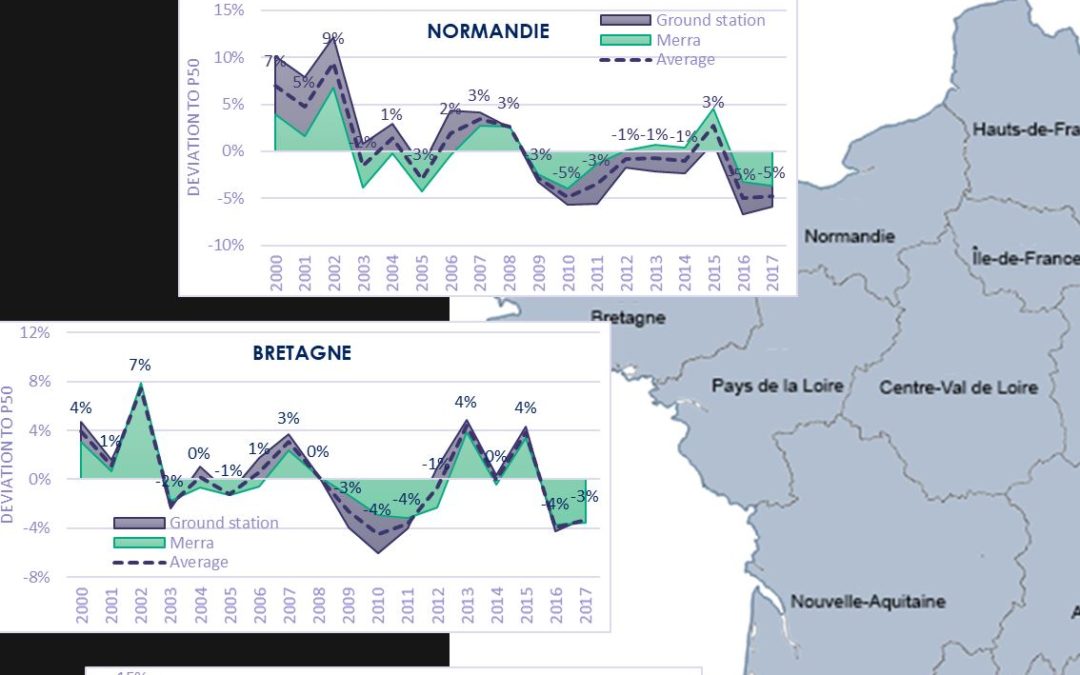
REGIONAL CLIMATOLOGY
France is characterized by specific wind regimes that can vary from region to another. We have therefore designed a map which identify trends for regions with the highest wind energy development:
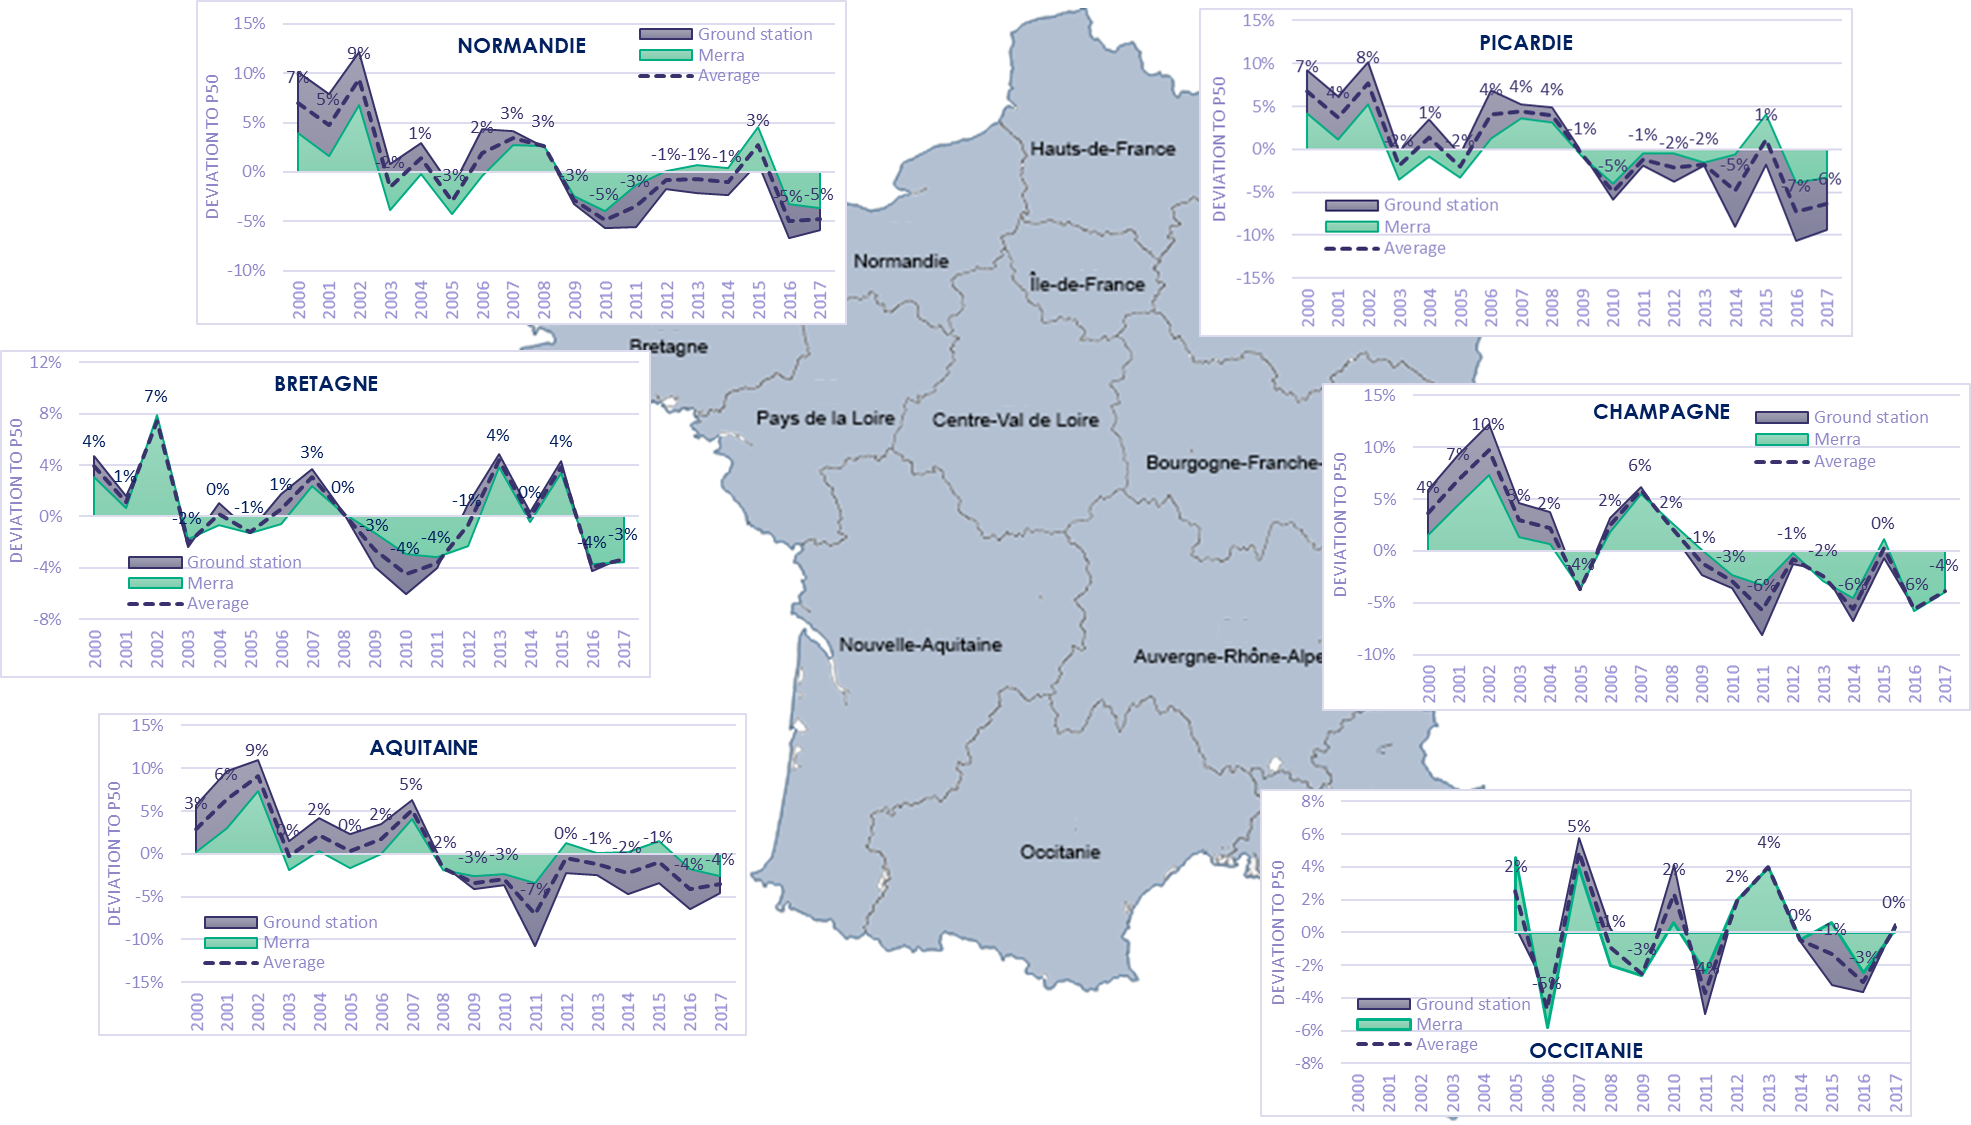
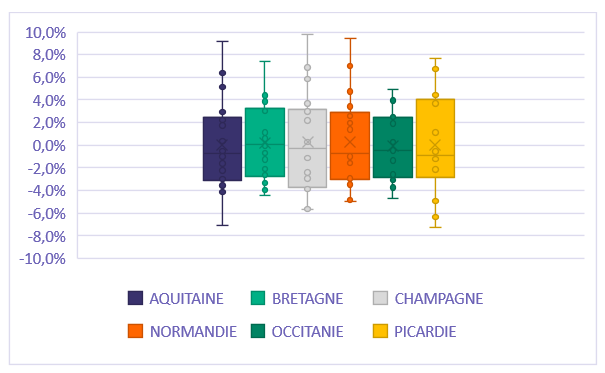
Annual normalised wind speed values were calculated over the long-term period, from January 2000 to December 2017, based on ground measurements and mesoscale data for all selected regions. High-low chart is displayed to show the inter-annual variability per region. This type of chart is particularly useful to offer a direct view of annual deviations to the P50 for each region, presenting the range with the highest and the lowest values.
For all regions concerned by this analysis – but the Occitanie region, the wind measured in 2017 was lower than the average trend observed over the last 18 years (2000 – 2017). On average, the wind regime in 2017 was 3.5% under expectations.
Moreover, over the last 18 years, annual wind speed values registered present large variations. In some regions, the width of the range can reach 16%.
METHODOLOGY
When estimating the wind climatology on the long term, selection of the reference data is essential. In this context, the representativeness of several data sources is analysed through a validation process.
Meso-scale data sourced from the MERRA-2 model were ordered via the NASA dedicated website [https://gmao.gsfc.nasa.gov/reanalysis/MERRA-2/]. A long-term time series was calculated at a defined location in the concerned region. Hourly data sets of wind speed and direction estimated at 50 m AGL were obtained for the last 30 years. Time reference is UTC.
Consistency of meso-scale models is uncertain before 1998 as they are directly affected by the climate-quality of observations. In particular, models inputs have considerably increased between 1998 and 2000. In this context, we have chosen to use exclusively data from 2000 for this analysis.
In addition to the meso-scale data sourced from the MERRA-2 model, data recorded at meteorological ground stations were ordered via the National Climatic Data Center website [https://www.ncdc.noaa.gov/cdo-web/]. These stations are located in airport areas; as data are also used in the aviation, this ensures data of high quality and a certain consistency in measurements.
Validation process then consists in comparing each dataset with each other via cross correlations over the long-term period extending from January 2000 to December 2017. This method enables to identify data sources with similar trends and point out data discrepancies.
Annual normalised wind speed values were calculated for each selected dataset over the long-term period, from January 2000 to December 2017. A virtual series was then generated over the long-term using a linear combination of ground measurements (50%) and modelled values (50%). This process enables to present the inter annual trend of wind speed over the long-term for each region (see graph above).
NB: with regards to the Occitanie region, data measured at the meteorological stations were not considered as much reliable as planned for the period before 2005; they have therefore been excluded from the analysis.