A recurrent question when operating a wind farm concerns the year to date profitability compared to expectations, i.e. what was estimated during the pre-construction.
In this context, an understanding of the regional climatology is essential and particularly the wind variability over years.
This note aims to help you understand the wind conditions in 2016 compared to the past climatology. As wind is directly linked to energy prediction, this could give you an indication about possible debt renegotiation.
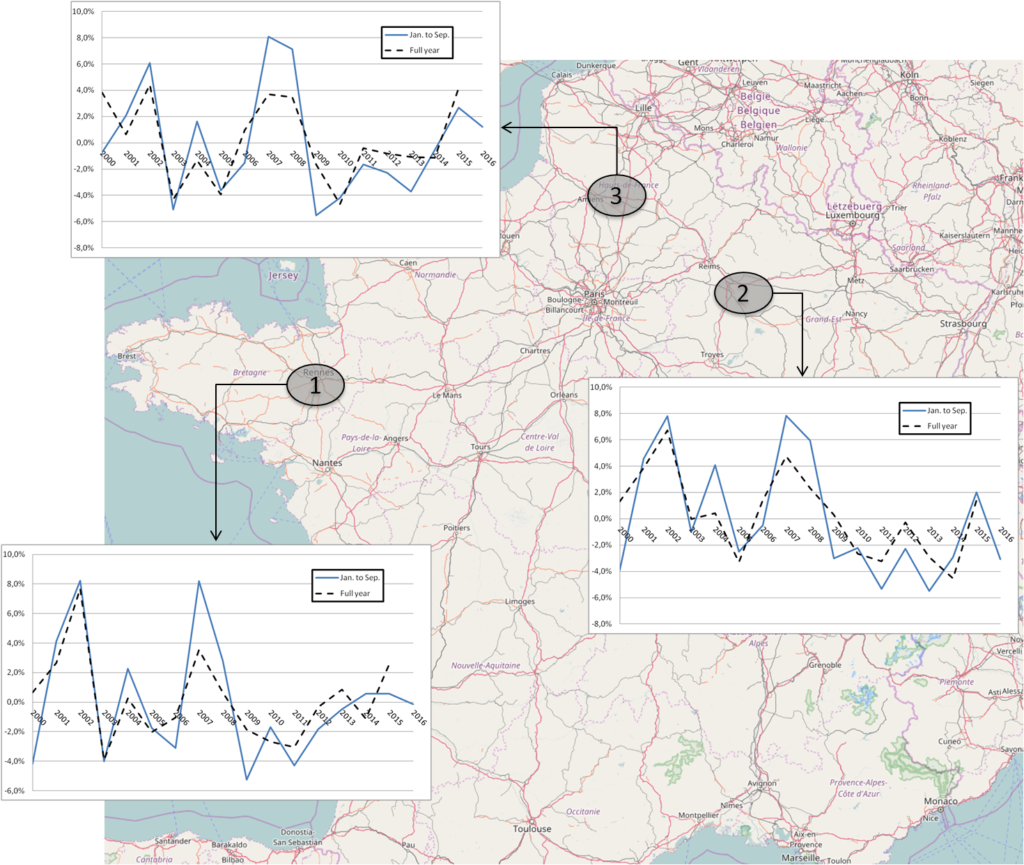
GEOGRAPHICAL EXTENT
Each site is characterized by a local wind regime that depends on the topography, vegetation, proximity with village/city…
Only a few regional trends were extracted in the context of this note but Greensolver is able to re-evaluate the coming net production of your wind farm (P50) with high precision if needed.
REFERENCE DATA
Meso-scale data sourced from the MERRA-2 / NASA model were used. A long-term time series was calculated at the grid point closest to the given area. Hourly data sets of wind speed estimated at 50 m AGL were obtained for the last 30 years. Time reference is UTC.
It is known that consistency of meso-scale models remains uncertain before 1998 as they are directly affected by the climate-quality of observations. In particular, inputs of the model have considerably increased between 1998 and 2000. In this context, only data from 2000 until now were retained in the current analysis.
To be consistent over years, comparisons were made over similar periods extending from January to September (solid blue line).
For information purposes, trends over full years were also plotted for the last 16 years (dotted black line).
INTERPRETATION
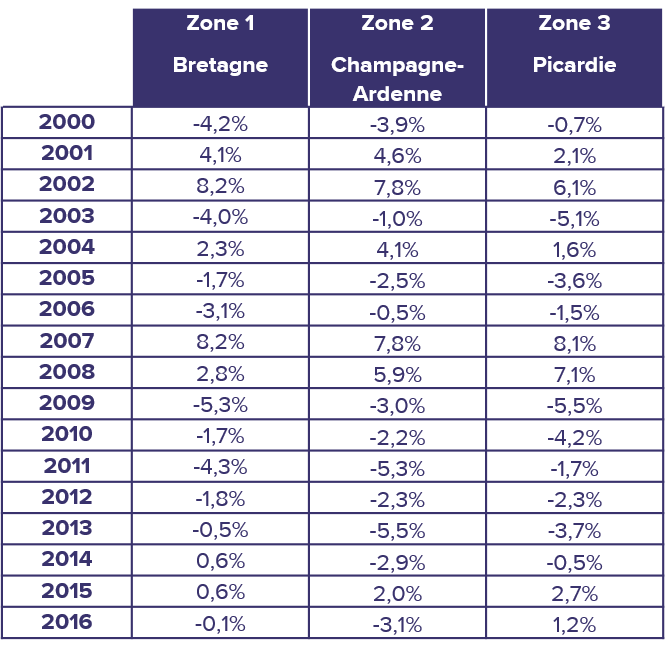
Depending on the wind farm location, the climatology for year 2016 is more or less windy. For example, in Picardie, the wind measured in 2016 was stronger by 1.2% than the average trend observed over the last 17 years (2000 – 2016) for the same period.
On the contrary; in Champagne-Ardenne, the wind measured in 2016 was lower by 3.1% than the average trend observed over the last 17 years (2000 – 2016) for the same period.
As the year is not yet finished, the climatology for 2016 can still evolved and even more so because important production figures are currently metered in France.